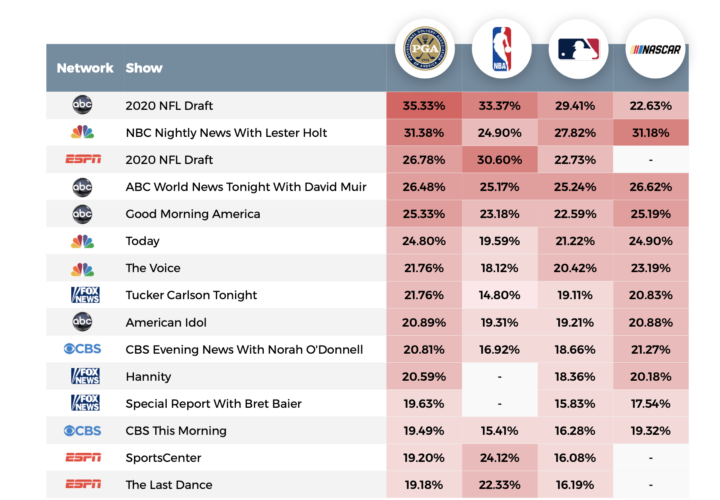
During another month without live sports, average sports fans were found watching the virtual NFL draft on ABC and NBC’s Nightly News with Lester Holt in the last two weeks of April, according to viewership trends from 15 million HHs.
In fact, sports audiences that were tuning into ABC’s NFL Draft were those that typically watch PGA (35.3%), NBA (33.3%), MLB (29.4%) and NASCAR (23.6%) programming.
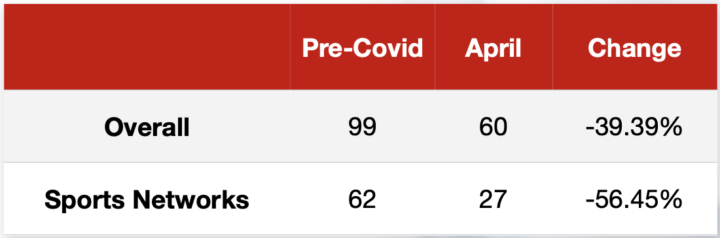
Moreover, only half of heavy sports viewers (those who spend at least half of their TV time on sports networks) tuned into sports networks in April, dropping 56% last month. TV viewership overall was down nearly 40%.
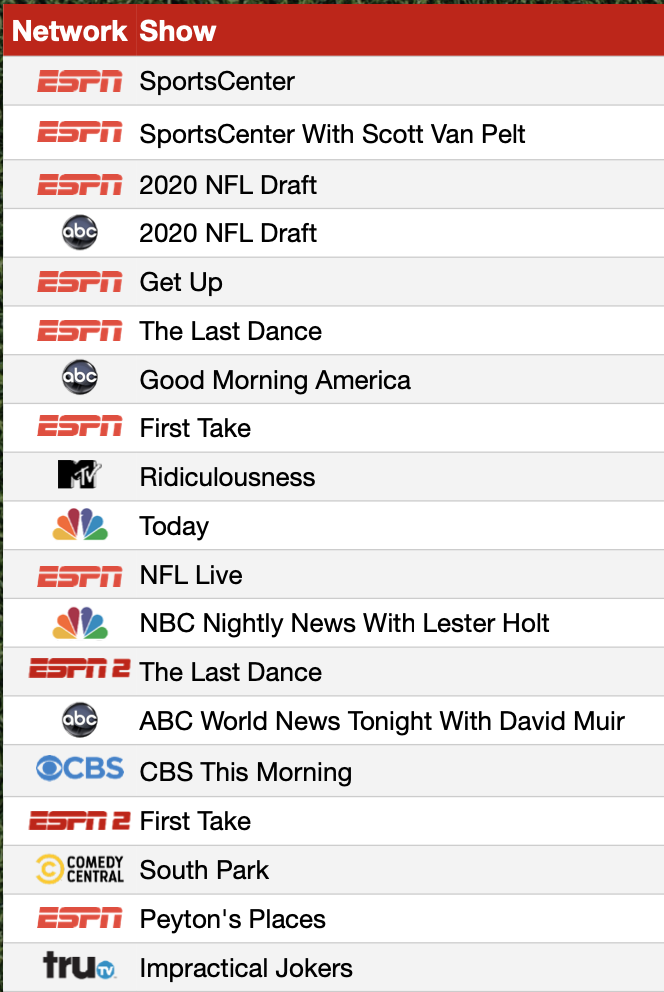
Heavy viewers remained loyal to sports networks with the ESPN’s SportsCenter, SportsCenter with Scott Van Pelt and the 2020 NFL Draft the top shows in April.
Outside of sports, shows like MTV’s Ridiculousness, Comedy Central’s South Park and Tru TV’s Impractical Jokers attracted this audience, as well as morning shows and news programs.
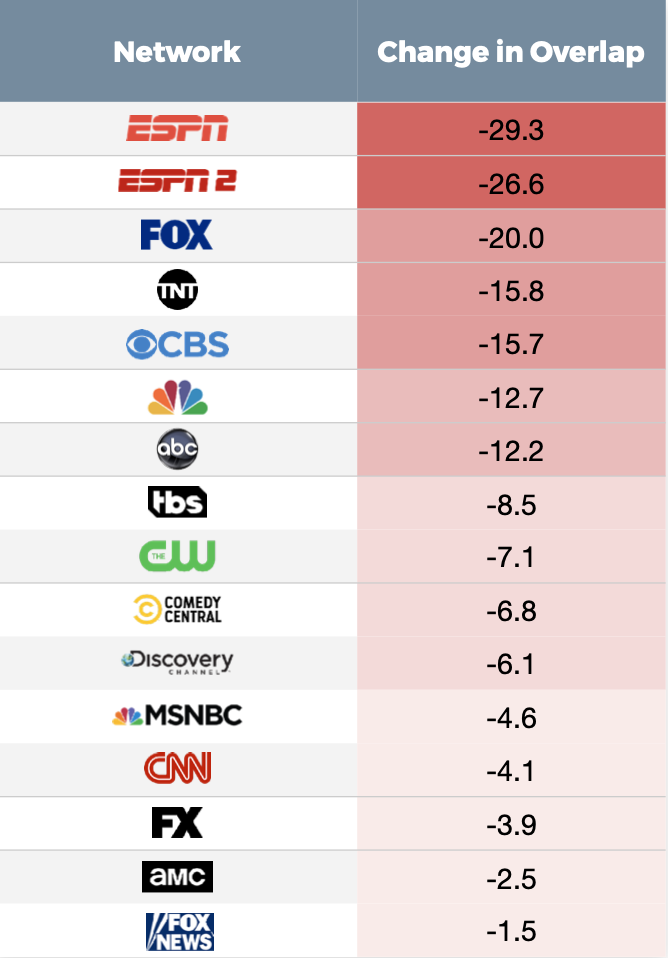
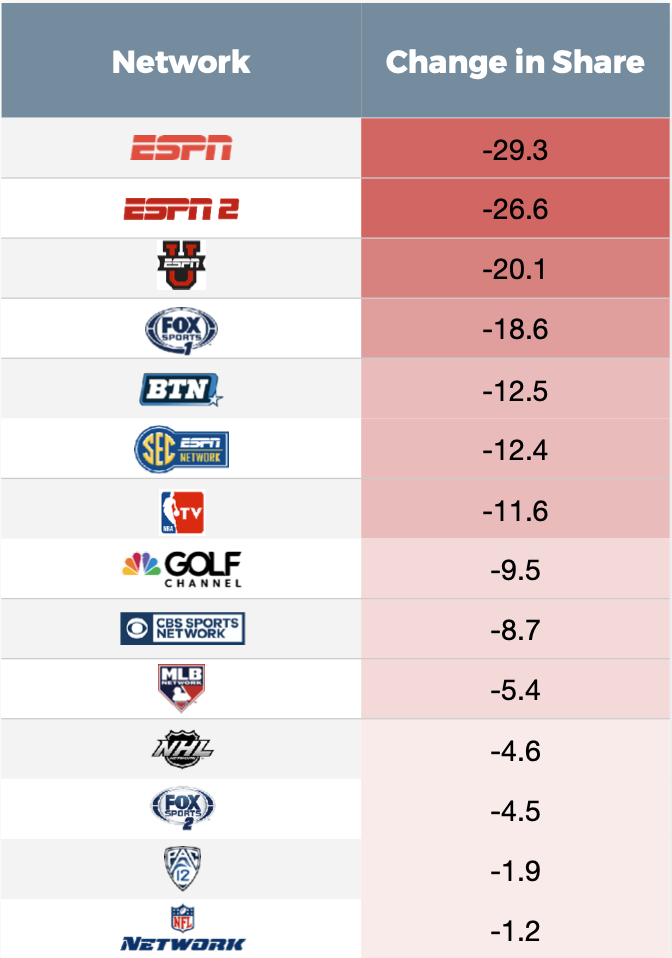
However, ESPN and Fox Sports saw the biggest declines among heavy sports viewers in April.
Considering all networks (not just sports), broadcast networks and TNT felt the most sting from heavy sports viewers tuning out in April.