We humans are creatures of habit. It’s no surprise that these habits become evident in TV viewing data, allowing us to discern the personality of TV-watching households. Here we explore month-to-month consistency in the number of unique networks watched by viewers. We can see that households fall into distinct classes based on their behavior. In order to study the robustness of TV watching behavior over time, we tracked randomly-selected households over the course of six months from October 2018 to March 2019, sampling TV watching habits during the first 9 days of each month.
The unique networks watched by a household on a month-to-month basis is highly consistent.
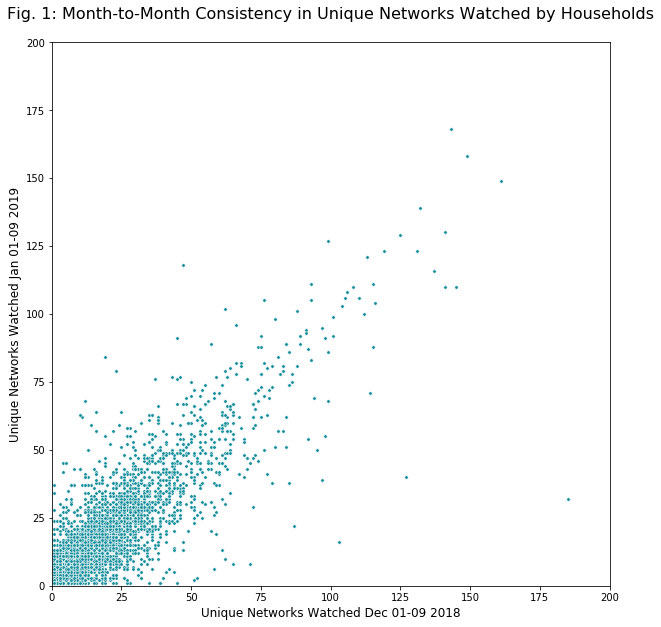
- Plotting the number of unique networks in one month versus another produces a scatterplot in which each point represents the behavior of a single household between two (not necessarily consecutive) months (Figure 1).
- In every pair of months examined, the cloud of points is highly correlated — forming a linear relationship — indicating consistency in the number of unique networks households watch over the course of a year.
Normalizing by the amount of time spent watching reveals consistent behavior in the number of unique networks watched per hour.
- We normalized the number of unique networks watched by each household by the total amount of time they spent watching, yielding unique networks watched per hour
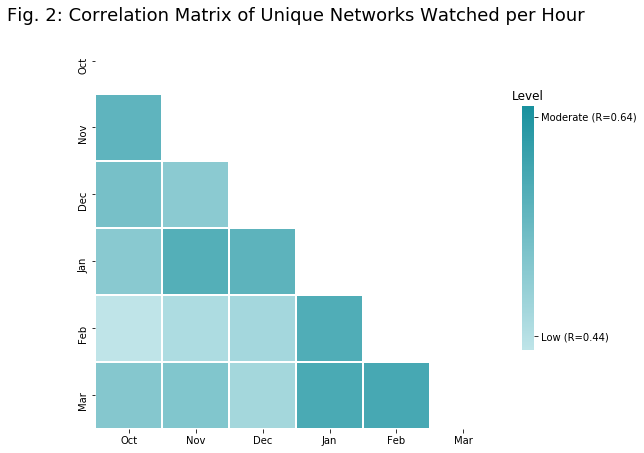
- The number of unique networks watched per hour was also highly correlated on a month-to-month basis (Figure 2).
- For example, the unique networks watched per hour in March 2019 was equally well predicted by the same household’s behavior in January or February of 2019. Additionally behavior as far back as October and November of 2018 still had significant predictive value for March of 2019
Household Behavior Partitions by Unique Networks Watched per Hour
-
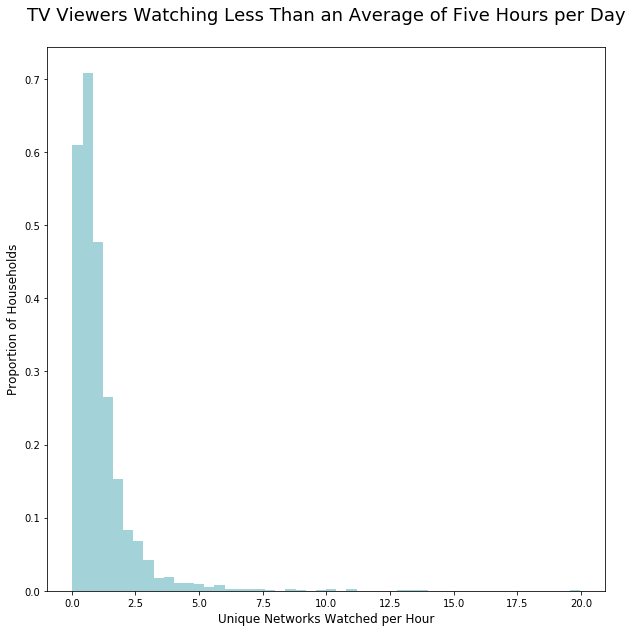
- To gain some insight into what the number of unique networks watched per hour means, we plotted the distribution of this metric for viewers that watched less than an average of 5 hours of TV per day (Figure 3).
- We found significant variation in the distribution of this metric, with many viewers watching an average of 1-2 unique networks every hour and a smaller subset watching many more unique networks per hour.
Conclusion
These analyses suggest that we can classify households with robust behavioral metrics. It is possible that households that exhibit high unique networks watched per hour behave differently than those with low counts in other ways as well. More work remains in exploring novel metrics and their relation to consumer behaviors outside of TV watching. Watch here for more insights from Alphonso Data Science.